The following was submitted as public comment for the FY26 budget deliberations:
Comment on FY26 Budget and CIP 8 April 2025
Dear City Council, City Manager, and CACT,
We appreciate the strong transportation elements in the FY26 budget, especially prioritizing the Secondary Campus bike route, bike/ped bridge replacements, sidewalk “Missing Links,” and multimodal upgrades to North and South Washington Street. It’s encouraging to see growing investment in walkability and bikeability. However, we’re concerned that the long-term return on our transportation investments will fall short without more attention to maintenance, staffing, and implementation of the Bike Master Plan. Here are six areas where we encourage the City to sharpen focus to ensure we build a safer, more connected, and more fiscally sustainable transportation system:
1. Paving: We’re Still Falling Behind
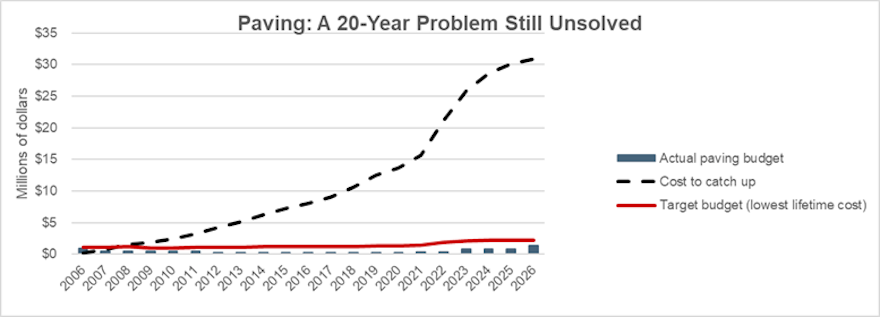
Roads are the foundation of our transportation system…and our biggest liability. The FY26 paving budget states it is $1M short of even a 20-year replacement cycle, much less the 12–15 year industry standard that delivers the best ROI. Past underfunding has left us with a $30M+ maintenance backlog (analysis in appendix), a PCI score of 64 (vs. target of 80+), and streets that are either neglected for decades or repaved multiple times in just a few years. The poor state of our roads and tight paving budgets have directly prevented quick-add bike lane installations over the past several years.
2. Maintenance: What We Build, We Must Maintain
We’re adding sidewalks, striping, signage, signals, flex-posts, and traffic calming but our after-inflation maintenance budget may not be keeping pace. Some new infrastructure is already in disrepair (like W&OD crossings and unreliable speed feedback signs) and high-maintenance elements like brick sidewalks and RRFBs are being added without clear plans for upkeep. Broken infrastructure is worse than nothing – the staff time and taxpayer money that went into installing it is not generating value for the City.
3. Staffing: Vacancies Persist and Contractors Can’t Replace Institutional Knowledge
Falls Church can’t efficiently build a safer, more walkable city without strong, permanent engineering and project management staff. Contractors are useful for flexibility, but they don’t know our context, can’t pivot across projects, and cost more long-term. Without staff, we miss chances to act quickly to add improvements at repaving or with development. We also make mistakes in the details, such as wayfinding signs added in the middle of sidewalks.
4. Bike Master Plan: Good Plan, But Pace Slowed Already
We support prioritizing the Secondary Campus route, but the proposed CIP pace (one route every 2-3 years) suggests it will take until 2050 to build a safe bike network. Meanwhile, we keep funding “easy wins” like Bikeshare, bike racks, and sharrows, which offer limited utility without an “all ages and abilities” network to connect them. We need to prioritize real progress on protected bike infrastructure that can serve 50%+ of the population.
5. Safety: Focus Where People Get Hurt
Neighborhood Traffic Calming (NTC) is well intentioned, but ~80% of projects since 2020 have been in lower-risk areas with few or no past injuries. About 50% of streets that had an NTC project now want another one or require special police/sheriff focus. Meanwhile, dangerous intersections like Park Ave & N West St remain unchanged, even after serious crashes and staff-developed safety plans. A data-driven approach would shift more resources to our most dangerous streets and would prioritize fixes that will solve the problem for good.
6. Snow Removal: Let’s Clear Trails Too
The City budgets for 6-8 snowstorms per year. As snowfall drops, we should consider using staff time to clear bike/ped trails and sidewalks in parks, especially the W&OD Trail. Please sign MOU with NOVA Parks to do this. The bike bus was stopped for several weeks this winter not because it was cold, but because the trails were not cleared of snow.
We appreciate the progress made this year and acknowledge the difficulty of budgeting during economic uncertainty. We hope for a holistic, well-maintained, staff-supported transportation system that delivers great value for money spent.
APPENDIX
Detail and data to expand on and support the concerns noted above
1. Paving: We’re Still Falling Behind
For nearly two decades, Falls Church has consistently underfunded its paving program. The chart below shows how serious the gap is. The blue bars represent the City’s actual paving budget from FY06 through the proposed FY26 budget. The red line shows roughly what the City would have needed to spend each year to follow industry best practices for a 12–15 year repaving cycle, adjusted for inflation using federal highway construction cost indices. The dashed black line shows how this gap has added up over time, with a cumulative paving shortfall nearing $30 million in FY24 dollars. This attempt to roughly size our liability does not account for the fact that roadway decay accelerates if maintenance is not done…$30M may even be a gross underestimate. We’d be happy to work with DPW or CACT to refine this estimate.
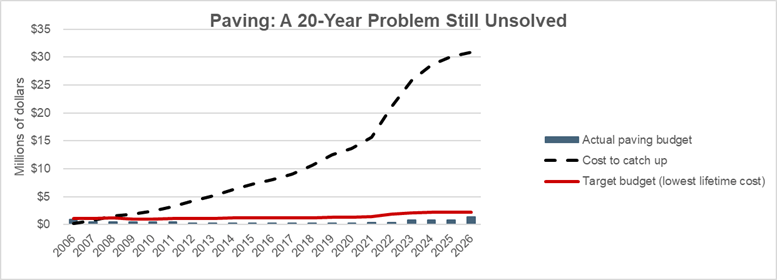
Source: City Budgets since FY07, National Highway Construction Cost Index, DPW Memo to CACT Oct 2023
Even in FY26, the proposed paving budget is still $1 million short of what DPW says is needed to achieve a 20-year repaving cycle, behind the12-15 year industry standard. As a result of underinvestment, the City’s Pavement Condition Index (PCI) sat at 64.2 of 100 in 2022 (lowest-cost would be in the 80s), with 48% of roads rated "good." For comparison, Richmond raised alarms in 2018 when only 35% of its roads were “good” and launched a multi-year catch-up plan. Arlington started to address its paving problems in 2012 when PC hit 68.9.
Budget constraints have created wildly inconsistent repaving schedules. Some streets are being resurfaced every few years or just in spots due to Fairfax Water projects or overlapping capital plans (e.g., Lincoln, Park, and Washington), while others haven’t seen fresh pavement in decades. These inefficiencies drive up costs, reduce service life, and often prevent the City from making bike/ped improvements at repaving when they’re the cheapest. The degraded road condition and minimal paving budgets also mean that new repaving is unlikely to even last the desired 15-20 years.
The good news is that the City has started correcting course, with modest increases since FY2021. But even with the current budget, we're still at a 30-year cycle—twice the recommended rate. Without sustained investment, the gap between actual and needed funding will continue to grow, and so will the costs to taxpayers. This is in effect a transfer of wealth from future taxpayers to past/current ones and could set off a downward spiral of worsening infrastructure requiring higher taxes to fix it which together make this a less attractive place for businesses and residents which compromises the tax base.
2. Maintenance: What We Build, We Must Maintain
Just like paving, Falls Church’s approach to maintaining transportation infrastructure appears to have been reactive and under-resourced for years. While we continue to add sidewalks, signals, crosswalks, flex-posts, brick paths, and traffic-calming devices, it's not clear that we’re setting aside sufficient funding—or staff time—to maintain what we build. We’re not adding new roads, but a safe, multi-modal road network is more costly to maintain than the wide-open blank pavement and handful of stop signs we had in the 1990s.
The story is familiar: underinvestment leads to higher costs, wasted effort, and missed opportunities. Broken speed feedback signs sit idle for months. RRFBs are costly to install and replace. Road markings wear away after a few winters, and new W&OD crossings are already showing signs of damage. Without a strategy—and budget—to keep these assets in good condition, their safety benefits fade and their repair costs compound. Worse, this undercuts the value of new capital investments and burns precious Staff bandwidth. If a $100k RRFB or speed sign doesn’t function, or if flex-posts vanish and aren’t replaced, we’ve lost both money and time.
The City has made great strides in building new infrastructure—but we now face a classic trap: expanding systems without expanding maintenance. Just as underfunding paving created a $30+ million backlog, under-resourcing maintenance will leave us playing an expensive game of catch-up. And in the meantime, safety and trust suffer.
3. Staffing: Contractors Can’t Replace Institutional Knowledge
Key concerns are DPW Engineering vacancies/retention and contractors for project management roles.
4. Bike Master Plan: Good Plan, Already Slowing Action
The City’s adoption of the Bicycle Master Plan in a few months ago was a major step forward. It lays out a high-ROI path to a safe, connected bike network suitable for people of all ages and abilities. But just a few months after Council unanimously endorsed the plan, the proposed Capital Improvements Plan (CIP) already shows slippage in execution.
The table below shows how the timeline for the top six routes—originally prioritized by staff based on equity, connectivity, and school access—has changed over the past year:
Route | FY25-30 CIP | Bike Master Plan (Jan ’25) | Proposed CIP (March ’25) |
East-West to Secondary Campus | FY2028 | 2025-27 | 2027 |
N West St | 2030 | 2025-27 | 2029 |
S West St | 2030 | 2025-27 | 2029 |
East Broad St* | 2029 | 2028-30 | No plan/beyond 2031 |
Great Falls St* | 2028 | 2028-30 | No plan/beyond 2031 |
Park Ave* | 2026 | 2028-30 | No plan/beyond 2031 |
* Routes identified for future consideration following completion of the first 3 priority routes
While we support the pivot to prioritize school access first, the updated CIP now shows just two routes completed by FY31, suggesting we may not see a full connected network until 2050 or later. That timeline undermines every Master Plan goal that is now legally part of the City’s Comprehensive Plan:
- Goal A: Provide an environment in which bicycling is safe and comfortable for people of all ages and abilities.
- Goal B: Provide safe and convenient access among neighborhoods and schools, parks, shopping, transit, employment and other destinations
- Goal C: Achieve status as a Bicycle Friendly Community by 2030
- Goal D: Ensure that Falls Church’s bicycle network connects with those of neighboring communities, and that Falls Church’s network is an integral part of the regionwide network
- Goal E: Increase bicycling rates and mode share in the City of Falls Church.
- Goal F: Maintain, operate, and grow the infrastructure that supports bicycling in Falls Church.
Meanwhile, the City continues to expand visible but low-impact infrastructure like Capital Bikeshare, bike racks, and sharrows. Without a connected network of low-stress routes, these investments serve only the most confident cyclists which limits ridership and reducing return on investment.
The map below, from the Bike Master Plan, illustrates this issue clearly. It shows clusters of low-stress streets (LTS 1) cut off from each other by major roads like Broad and Washington. Bikeshare stations (existing and planned) often sit inside or near these isolated “islands,” disconnected from each other and the broader city. Over 50% of the use of Capital Bikeshare is to get to East Falls Church Metro, which is done from those Bikeshare stations that share a LTS 1 cluster with the W&OD Trail or are close enough to make a bike ride on the sidewalk palatable.
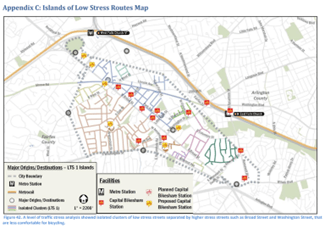
To realize the promise of the Bike Master Plan, we must prioritize building the network itself—not just the accessories around it. Without safe routes connecting schools, parks, and business districts, cycling will remain a niche mode of travel for most residents, no matter how many Bikeshare docks or racks we install.
5. Safety: Let’s Focus Where People Get Hurt
We support Neighborhood Traffic Calming (NTC) as a tool to improve livability and comfort on residential streets. But in recent years, the program’s investments haven’t aligned with where the highest safety risks exist. NTC projects are initiated by resident petitions, so the deciding factor often becomes how organized a neighborhood is, not how dangerous a street is. As a result, many projects are installed on streets with no history of crashes, while intersections with repeated injuries see no change for years, even after Police and Public Works recommendations.
The table below shows the number of reported injuries from 2018-2023 on NTC and NTC-adjacent project locations. With few exceptions, these streets had zero or one crash involving injuries, despite receiving significant investments in curb extensions, striping, or flex-posts. Meanwhile, some of our highest-crash intersections that have seen 30+ injuries in the same period remain unchanged.
NTC Project | # of Injuries 2018-2023* | Notes |
Annandale & Gundry (2020) | 0 or 1 | Complaints persist post-project |
Lincoln Ave striping (2020) | 14, almost all at intersections | Complaints persist, now doing Greening of Lincoln |
W Jefferson St (2020) | 2, both @ Little Falls | Removed parking, did not change intersection |
N West St (2020) | 11, 2 @ Highland Ave, 9 @ Great Falls | Complaints persist, now part of Bike Master Plan project |
Seaton Ln (2020) | 1 | Complaints persist, now doing Greenway Downs |
Great Falls & Little Falls (2021) | 5 | Curb extensions shrunk from engineers’ recommendations |
Little Falls & Columbia (2021) | 1 | Curb extensions shrunk from engineers’ recommendations |
Noland St (2021) | 0, only crashes at Broad St | Complaints persist, now have new sidewalk and NTC projects |
Grove Ave (2022) | 3 | Funded by Founders Row |
Dorchester X-Walk (2022) | 0 | Sherrif still regularly deploying speed feedback trailer |
S Lee & S Oak St (2022) | 0 or 1 | Still left very wide road and does not prohibit illegal parking |
Lawton St (2022) | 0 | Funded by Broad & Washington developers |
Virginia & Great Falls (2024) | 0 or 1 | No painted crosswalk, sight lines still challenging |
E Columbia, 29 to Cherry (2024) | 0 or 1 | Neighborhood rejected staff recommendation, flex-posts unlikely to deter 50+ mph speeding drivers |
E Jefferson St (2024) | 0, only crashes at Washington St | Very low traffic volumes |
N Roosevelt St (2025) | 0, only crashes at Broad St and Roosvelt Blvd | Follows prior requests from the neighborhood that resulted in installing “No entry during rush hour” signs. |
Lincoln & Yucatan (2024) | 0 | Apparently driven by one neighbor’s complaint |
* Source: VDOT TREDS Map, some crash locations are not precise
This data doesn’t mean NTC projects are worthless, but they are prioritized based on risk relative to other projects in the queue at the same time (not based on city-wide risk) and the designs implemented are often ineffective at achieving the goals of the neighborhood. P90% of injuries in the City happen on streets signed 25–30 mph. Per the table above, 80% of NTC projects are on 20 mph streets and 50% do not resolve the neighborhood’s concerns.
Outside of NTC, when crashes do happen (like the May 2024 serious injury of a senior citizen at Park Ave & N West) the response has been slow. Nearly a year later, despite a reviewed plan from both the Public Works Director and Police Chief, no changes have been made to that intersection.
To improve safety outcomes and use taxpayer funds more effectively, we recommend:
- Targeting traffic-calming investments where injuries and crashes have occurred.
- Setting aside a portion of NTC funds for proactive, data-driven fixes on high-speed streets.
- Ensuring crash reviews result in timely action, not just documentation.
- Do fewer, better projects and focus elsewhere if the neighborhood doesn’t support effective changes (avoid the repeated situation where the journey to neighborhood consensus results in a watered down or expensive solution that is clearly going to have a low ROI)
The City aspires to implement Vision Zero for eliminating serious traffic injuries and deaths. That won’t happen until our investments follow the data and we install changes that will solve the problem and we can afford to maintain.